
The baseball world is on hold for the time being, but the beautiful thing about America’s Pastime is that there’s always something new to read up on.
In recent years, advanced numbers have become a topic of large debate on social media forums. Typically, it’s the younger generation who have fallen in love with this “new era” line of thinking while the older generations tend to be a bit hesitant to welcome in any new means to evaluate players.
The point isn’t to degrade people for trusting a different group of stats but to attempt to inform. There’s a beautiful world behind the curtain, and to reject it immediately without attempting to understand them would just be irresponsible.
I tend to use a lot of advanced metrics in my articles, especially when evaluating and comparing players. However, I owe it to the readers to inform you of what they all mean. Numbers are great but are nothing without an understanding.
Bear with me.
Weighted On-Base Average (wOBA)
Weighted on-base average is basically the same as on-base percentage. However, the difference is you’re graded based on how you reach base.
On-base percentage treats all avenues of reaching base the same, whereas wOBA rewards people who reach base via extra-base hit more often. The equation for this metric for the 2019 season is as follows:
(0.690xuBB)* + (0.719xHBP) + (0.870x1B) + (1.217x2B) + (1.529x3B) + (1.940xHR) / (AB = BB – IBB + SF + HBP)
(*u = means unintentional)

The weights change marginally every season, but that shows you why something like wOBA could be better than OBP: because it doesn’t treat all times reaching base the same.
Average: .320
Weighted Runs Created Plus (wRC+)
This is a rate stat that is both park and era-adjusted.
What it attempts to do is reward a batter for each outcome, rather than treating them all the same, like batting average does. To accurately account for this metric, the league average is set at 100 each season, which means every point above or below is x percent above/below average you were for the season.
Example: Mike Trout of the Los Angeles Angels led the majors with a wRC+ of 180 in 2019, meaning he was 80 percent above the league average. On the other hand, Orlando Arcia of the Milwaukee Brewers had the lowest wRC+ among qualifiers with 61, meaning he was 39 percent below average.
Isolated Power (ISO)
ISO is your slugging percentage minus your batting average.
In laymen’s terms: extra-base hits per at-bat.
Average: .140
Expected Statistics
Expected statistics (xBA, xSLG, xOBP, xwOBA, etc.) take into account what your numbers would look like with league average luck on balls in play. They factor in the quality of contact, exit velocity, launch angle, and other things of the like.
It’s a good measurement to evaluate what kind of hitter your favorite player might be.
Example: Fernando Tatis, Jr. of the San Diego Padres posted a .317 batting average in 2019. However, he was rated the luckiest hitter in the game (among qualifiers). His expected batting average was just .259, meaning his actual average was 58 points higher than it should’ve been. On the other hand, Marcell Ozuna, now of the Atlanta Braves, was rated the unluckiest, sporting an actual average that was 47 points lower than expected (.241 versus .288).
Defensive Runs Saved (DRS)
Simply put, it’s how many runs you saved or cost your team for the season.
Matt Chapman saved 34 runs for the Oakland A’s a season ago, leading baseball. On the other hand, his former teammate Jurickson Profar cost his team 15 runs.
The defensive metric used to calculate Baseball-Reference’s wins above replacement (bWAR or rWAR).
Ultimate Zone Rating (UZR)
This takes into account the runs you save based on your zone. It’s divided into several subdivisions:
- Arm Runs (ARM): How many runs you save by preventing runners from advancing (only measured for outfielders).
- Double Play Runs (DPR): How many runs an infielder saves by turning a double play.
- Range Runs (RnR): How many runs are saved based on a player’s range.
- Error Runs (ErrR): How many errors a player makes in comparison to a league-average defender at their position.
The defensive metric used to calculate FanGraphs’ wins above replacement (fWAR).
Fielding Runs Above Average (FRAA)
I’ll only use this metric for catchers because it takes into account their ability to frame pitches, which isn’t a part of UZR or DRS’s calculation.
This defensive metric used to calculate Baseball Prospectus’ wins above replacement (WARP).
Outs Above Average (OAA)
This is probably the best defensive metric for non-pitchers and catchers. This calculates probability. If you make a lot of plays that should result in hits and limit the number of routine plays you botch, your OAA will be higher.
Fielding Independent Pitching (FIP)
FIP is what a pitcher’s earned run average (ERA) would be if he benefitted (or sometimes fell victim to) league-average defense on balls in play.
For example, Max Scherzer of the Washington Nationals posted an ERA of 2.92 in 2019. But, in reality, it would have been 2.45 had he benefitted from league average luck on balls in play.
Expected Fielding Independent Pitching (xFIP)
Run prevention based on plays that don’t involve defense. Outcomes like strikeouts, walks, hit by pitches, and fly balls allowed are accounted for.
It normalizes home run rate, and couples with an estimation on your run prevention due with league average luck on balls in play, as well as league average luck on home runs per fly ball.
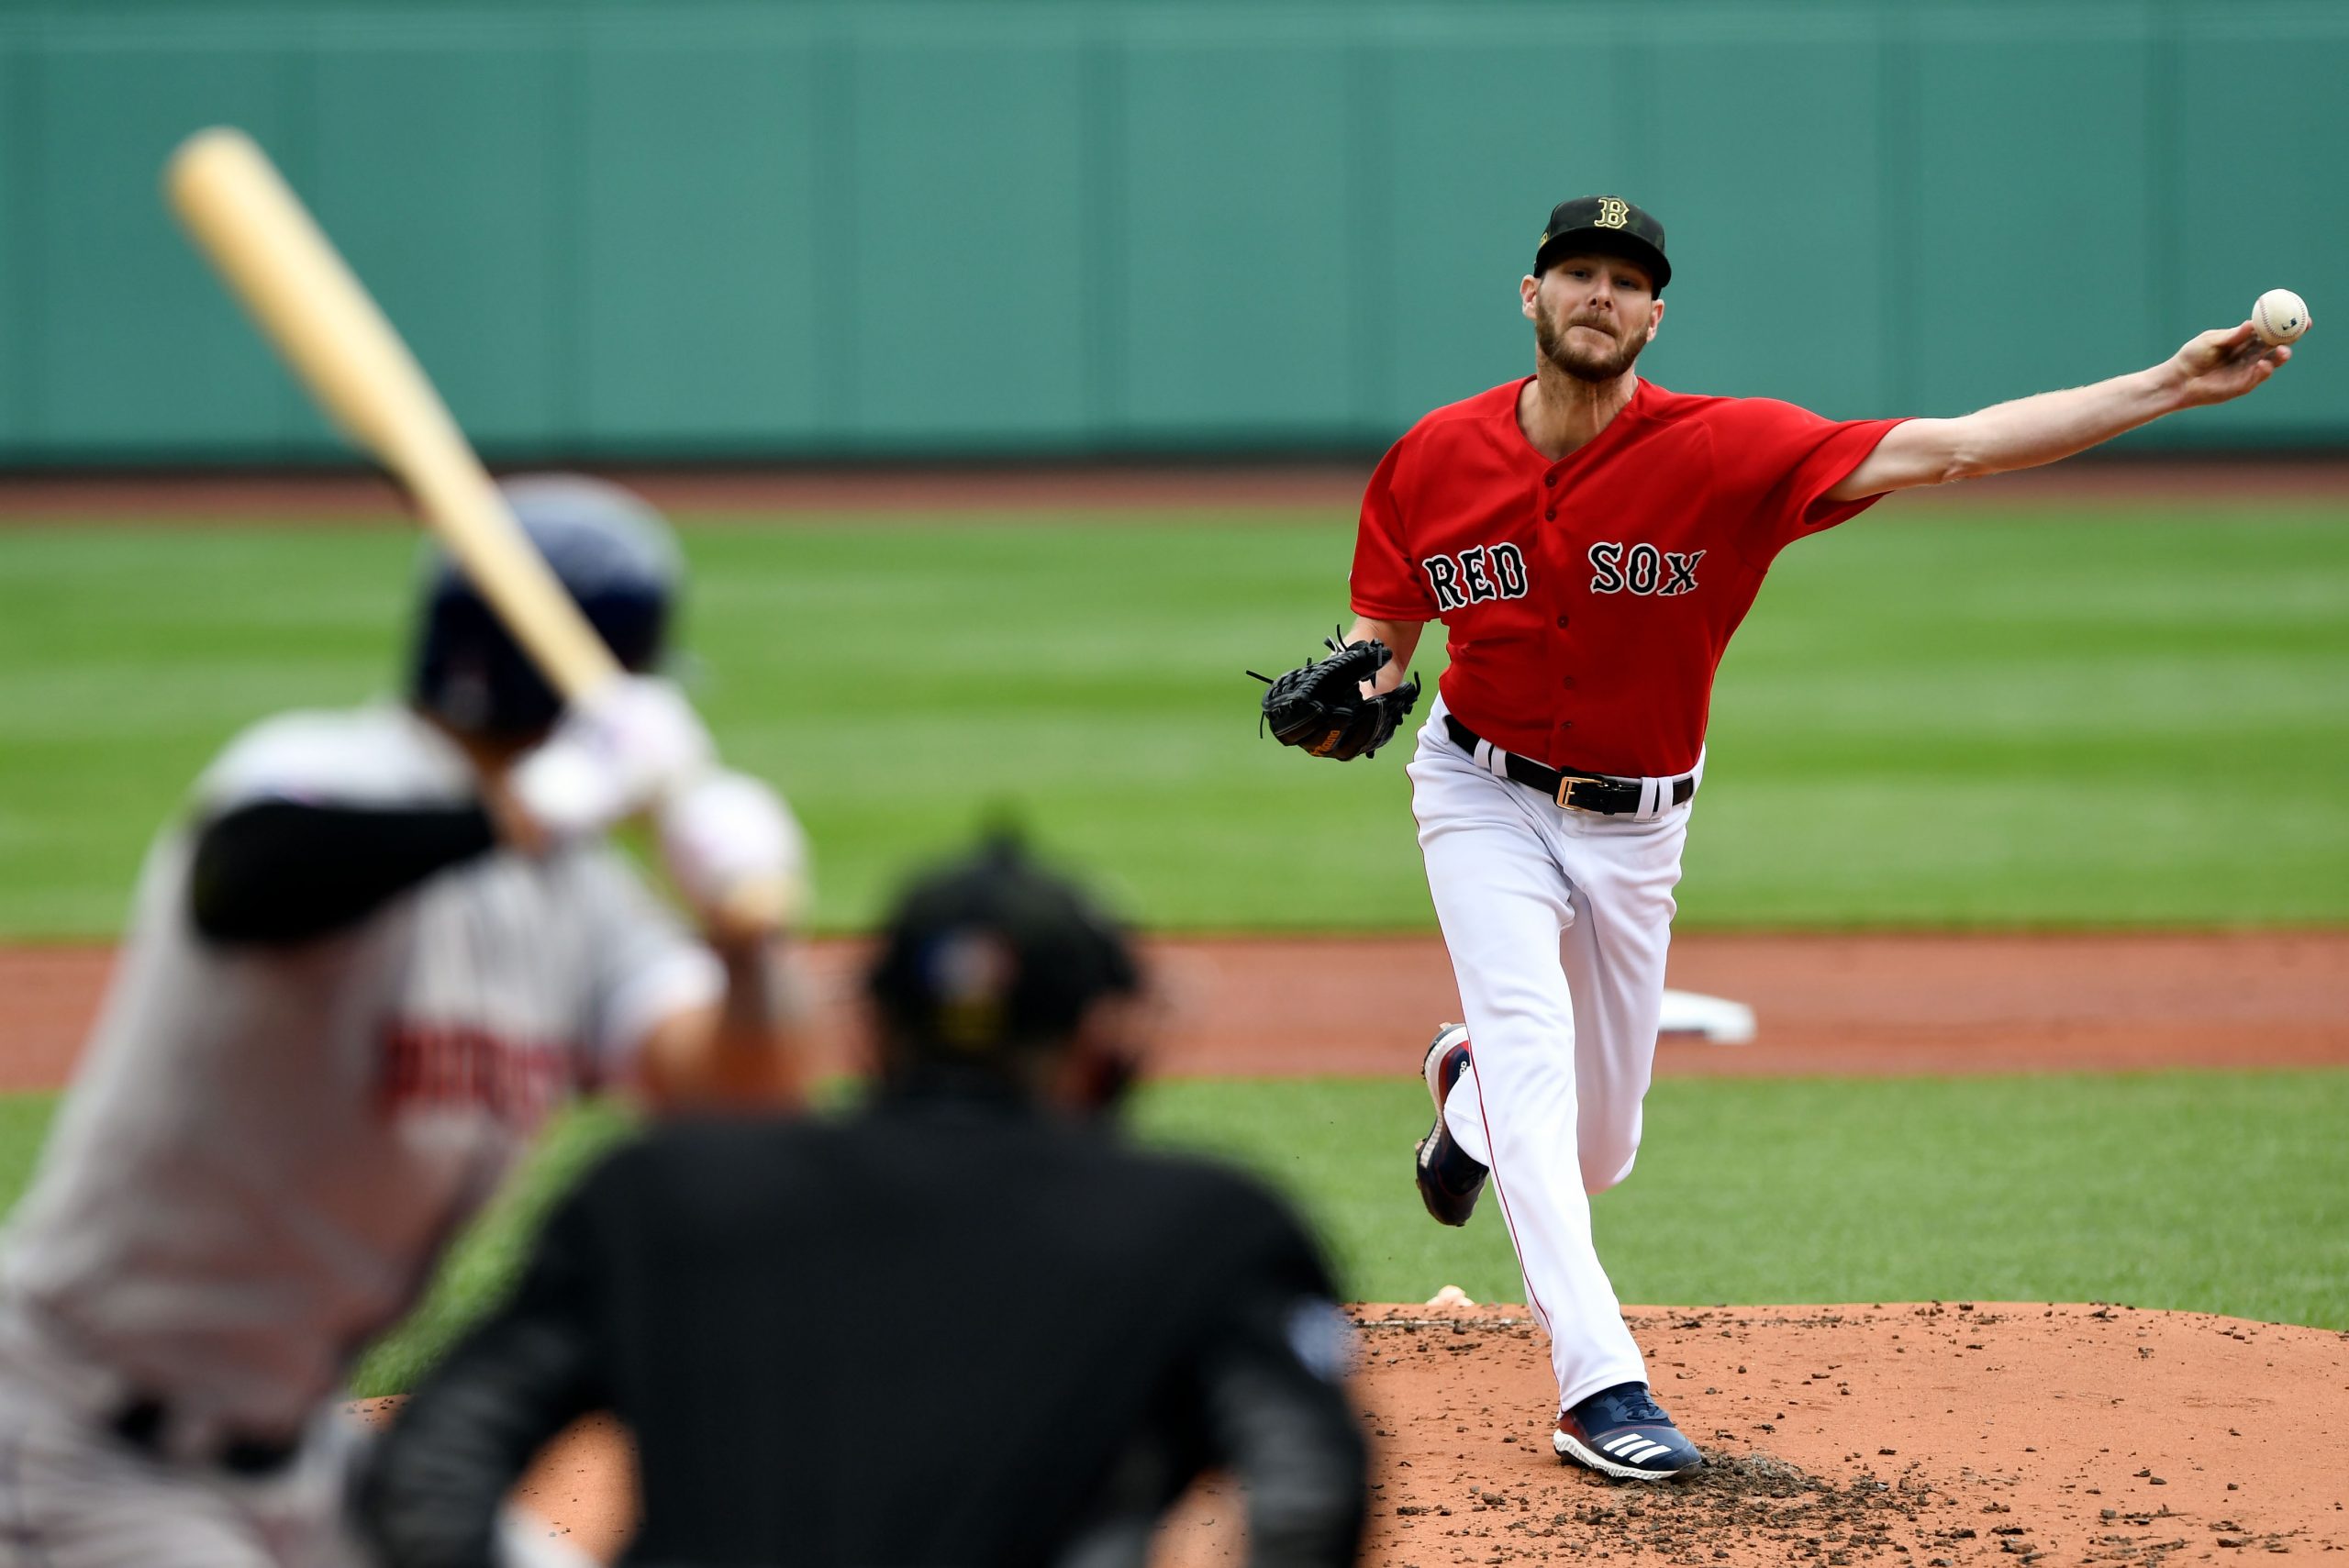
Skill-Interactive ERA (SIERA)
This metric is another ERA estimator. It takes into account all balls in play but tries to understand why some pitchers are better at generating weak contact and getting outs than others.
It is far more rewarding for pitchers who strike out a lot of batters and generate a lot of weak contact.
Example: Among pitchers with a minimum of 140 innings pitched, Chris Sale of the Boston Red Sox (35.6 percent strikeout rate) ranked fourth in baseball with a SIERA of 3.00 despite posting a 4.40 ERA. On the other hand, Zach Davies of the San Diego Padres (15.2 percent strikeout rate) posted a 5.43 SIERA even though his ERA was 3.55 with Milwaukee last year.


One Response
Good stuff, Jordan!