
Antonio Losada| July 2nd, 2019
The New York Mets are a bad ball club. Yes, they won their last game against the juggernaut Atlanta Braves at Citi Field this past Sunday to close June. The problem is that that win came after a staggering seven-game losing streak.
Of course, being part of the National League East was never going to make things easy for the New York team. The division is loaded, to say the least. Although both the Washington Nationals and the Philadelphia Phillies are playing under expectations (they were projected to 90 and 85 wins per Fangraphs and they look short of reaching them), Atlanta has blasted through the field and is currently holding the Number one spot in the division with a 50-35 record that projects to finish at 91-71 by season’s end.
The Mets, right now, are as close to the Phillies as they are to the bottom-ranked Marlins. The Mets, by the way, were expected to have a .517 win percentage as the season started, but they’re currently bearing a .447 W% having won only 38 of 85 played games.
The chances of New York winning the NL East as of this writing are under 1%. The chance to get to (and win) a WC game is at 6.2%. Their odds for a WC berth is 0.1%. Not really encouraging, surely.
It wouldn’t be fair to put all the blame on one single player. The front office and the club’s staff is a mess, and the team as a whole is underperforming. Even with that, the starters for the Mets this season haven’t been that bad.
Here are some graphics that highlight both the Mets and average MLB starters stats during the first half of the season:
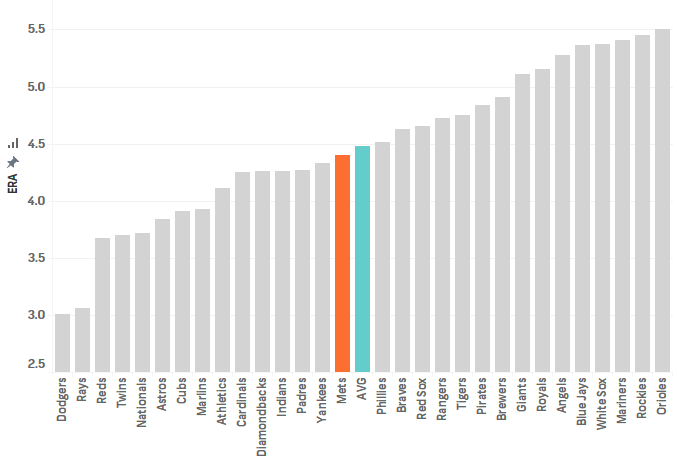
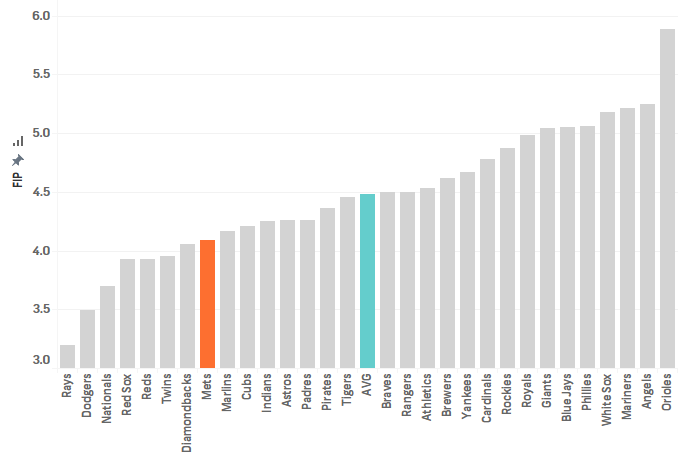
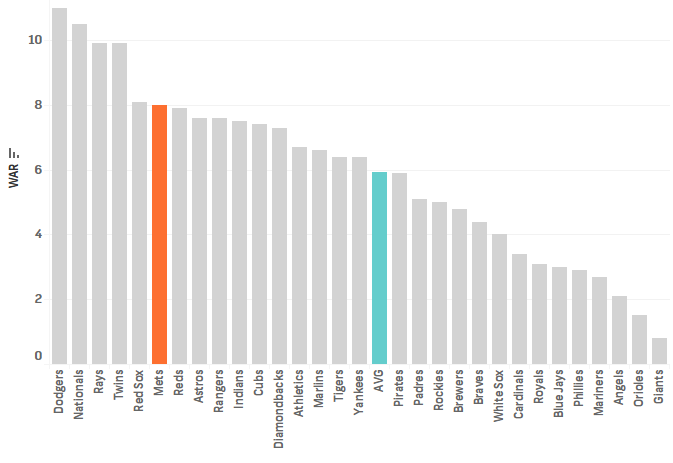
Again, not bad at all. And considering the starting rotation of the team, that is kind of normal. We’re talking about Zack Wheeler, Jacob deGrom, Noah Syndergaard, Steven Matz, and Jason Vargas. Every one of them has started at least thirteen games so far, yet only three have W-L percentages over .500.
Coincidentally, the one with the highest winning percentage (not that it matters much, though), Noah Syndergaard, is also the one having a little bit of a letdown season given the expectations. Among Mets’ pitchers, he’s also not being exactly the leading man and his numbers have been career-low all over the board.

For starters, Syndergaard has seen his ERA, FIP, and WHIP all rise during this season. He’s got the worst ERA of all the aforementioned five starters barring Steven Matz (4.56 to 4.95). His FIP sits at 3.76 and is only lower than that of Vargas and Matz. He’s also third among New York’s starters in WAR at 2.1 now.
Looking at ZiPS projections, they expected him to post a 1.5 lower ERA and a 0.9 lower FIP, accounting for a season-long 4.2 WAR. While he may be on track to that last number value by the end of the year, his underlying numbers are not even close to what he should be doing.

It can’t be said that Noah Syndergaard has regressed because he’s always had more or less similar production (excluding the kinda fluky 2017 season in which he only played seven games), but he’s definitely worsened his numbers all along for the worst marks since he entered the major circuit.
The reasons behind this slump can be found looking practically in any direction.
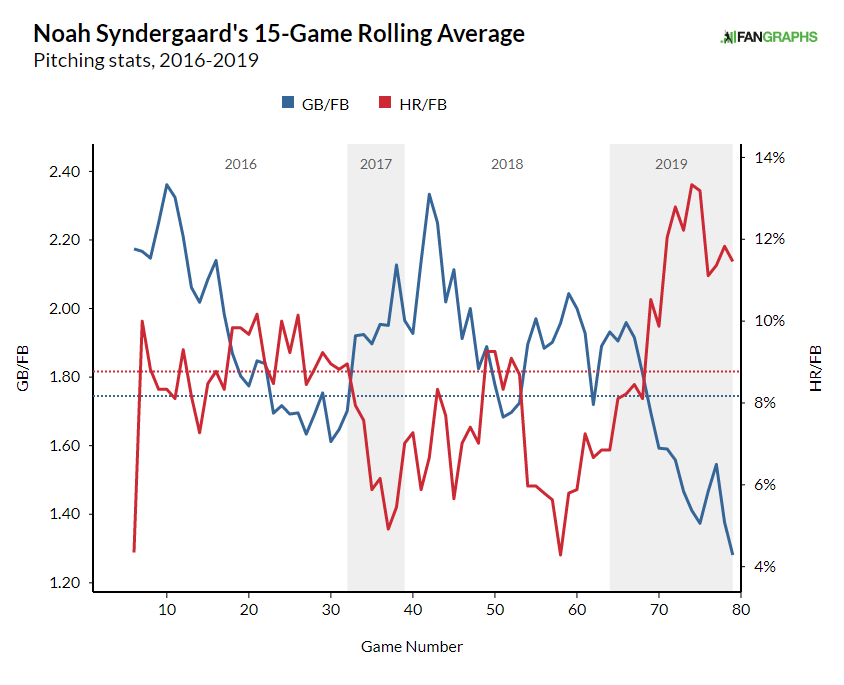
On average, the whole MLB is trending toward a lower GB/FB number. Hitters are changing their approach to facing pitchers and more fly balls are being hit each and every day. Syndergaard is still over the average (1.33 GB/FB, the league-average is at 1.20 currently) but is having his worst season in that regard since 2015.
This fact hurts him even more while taking into account the HR/FB ratio he’s also posting this year, which as the graphic above shows is definitely the highest he’s ever conceded in the past four seasons. More fly balls, of which more than ever turn into homers, is definitely not a good pairing. What last year almost never topped 8% on a 15-game rolling average has turned into an around 12% mark this season, only three points under the MLB average-pitcher (starters and relievers) value.
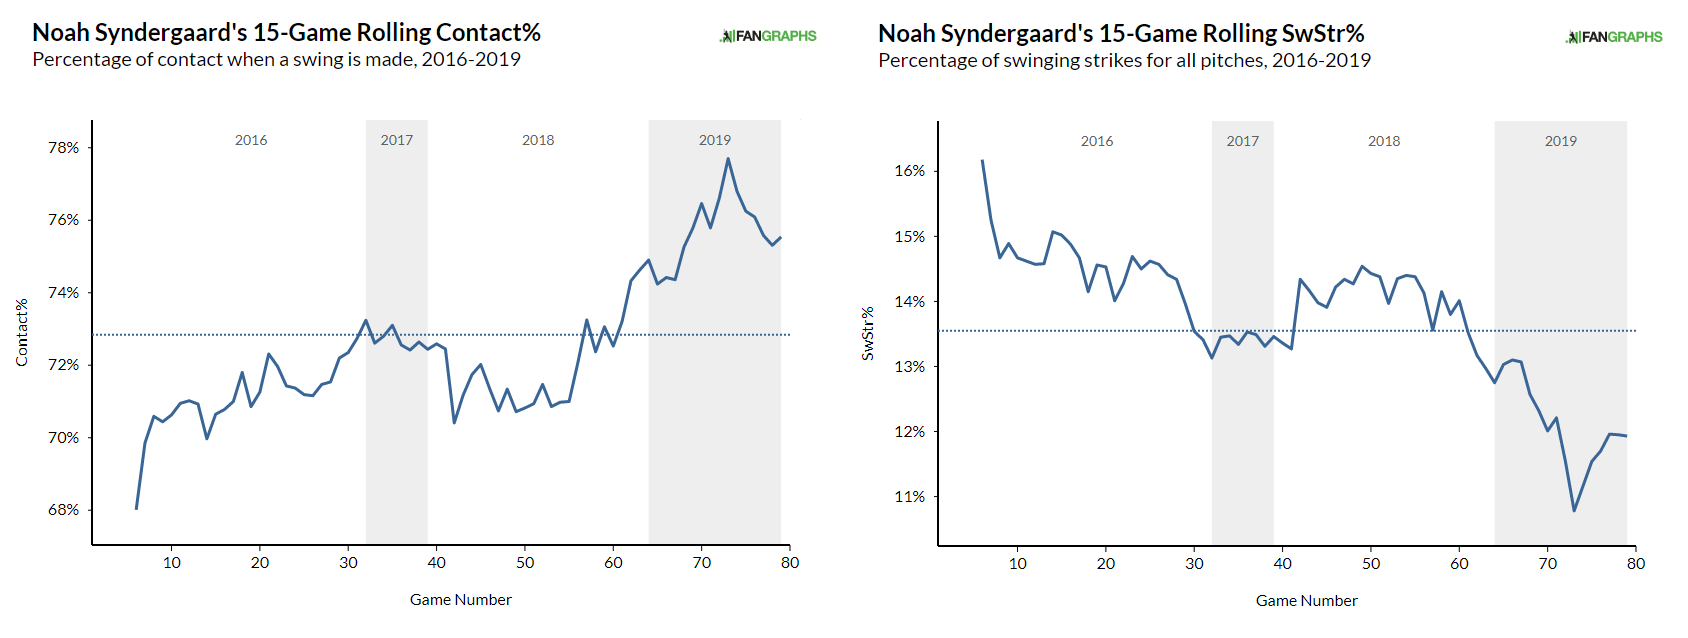
Another couple of badly directed trends are those related to the contact hitters are making with Noah’s pitched, and how he’s not striking out batters that much this year on swings.
Although he’s maintained his pitch profile more or less stable during the past years, raising the percentage of thrown changeups and keeping it at around the mid-tens for all of his career, the number of fastballs he’s throwing in 2019 in comparison to every year other than 2016 is considerably higher:
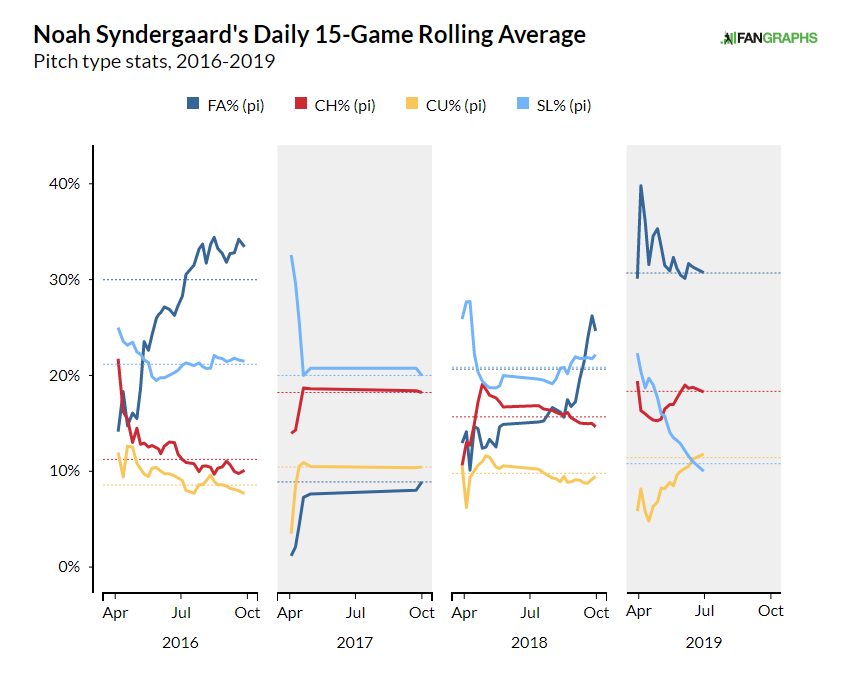
He’s moved from a 20.7% of fastballs in 2018 to 30.7% this season, while he’s cut his sliders almost in half (from 20.9% to 10.8%) and raised the number of changeups he’s throwing (from 15.7% to 18.3%). The graphic allows us to see more clearly how the arsenal of pitches and more than anything its usage is much more spread this season than in years past, not that it is helping him get better results though.
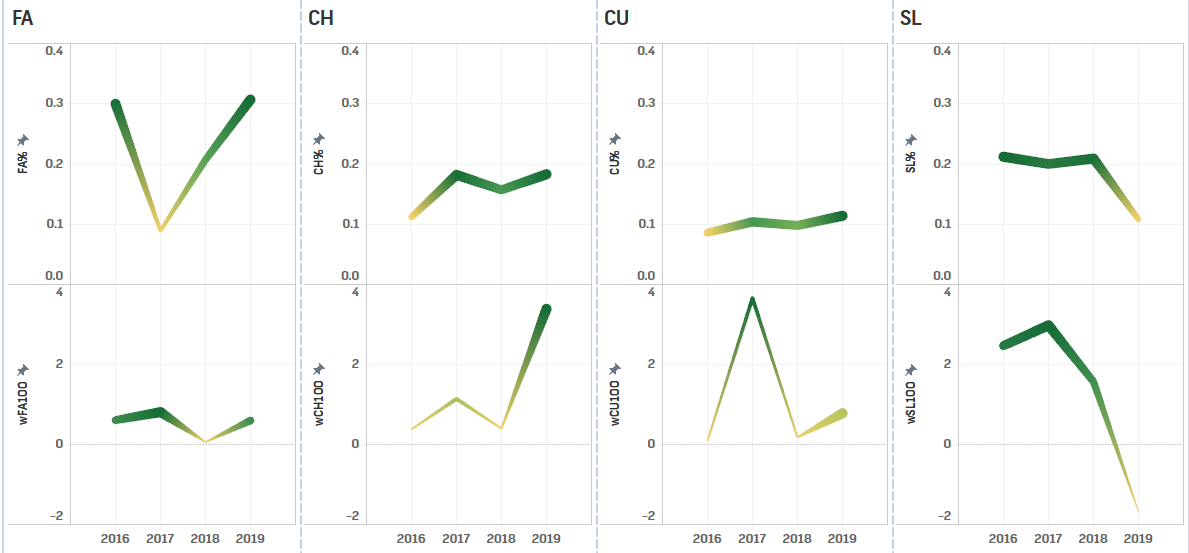
The picture above shows each of the four pitches Syndergaard has thrown this year, sorted from higher to lower usage percentage. The usage is shown on the charts on the top row. On the bottom row, I’ve plotted the average amount of runs he has allowed against 100 pitches of each type. Positive values are good, negative values are bad.
As you can see, the highest amount of runs Noah is conceding are coming from sliders. It can be understood that he’s only throwing them 10.8% of the time. On the other hand, though, he’s throwing a lot of fastballs (more than ever) yet his value is only at 0.6 per 100, the lowest of those on the positive side of things. Although the changeup has been more valuable in preventing run for Syndergaard, he’s using it only around 60% more of the time.
All in all, and although Noah is having some sort of a downside year, his underlying numbers don’t look terribly bad and a couple of tweaks here and there for the remainder of the season could prove to be the only thing needed to reach what we believed we’d see from Thor in 2019.
Entering July, and given his past, there is still plenty of time to reverse the trend and turn a middling year into one on par with those from the past. If only the Mets could get things together.
Questions and comments?
thescorecrowsports@gmail.com
Follow Us on Twitter @thescorecrow
Follow Us on Reddit at u/TheScorecrow
Follow Us on Facebook at The Scorecrow
Follow Us on Instagram at The Scorecrow
Facebook Group where you can read and post articles at The Scorecrow
Reddit Group where everyone can post without fear of being banned at The Scorecrow
Follow Antonio Losada on Twitter @chapulana
Main Image Credit: [getty src=”1159331472″ width=”594″ height=”406″ tld=”com”]