Fifty-seven different quarterbacks trotted out onto the field to make starts in 2019. Thirteen quarterbacks started all 16 games. Five started just one game.
Noticing the best one is a difficult science. Matt Ryan completed the most passes. Drew Brees completed passes at the highest rate. Jameis Winston threw for the most yards. Lamar Jackson paced the league in touchdowns and touchdown percentage. Aaron Rodgers had a microscopic interception rate. Ryan Tannehill led the league in passer rating. Tannehill also posted the highest offensive and passing PFF grades. Jackson was named MVP and First-Team All-Pro at quarterback. Who was the best?
Pro-Football-Reference has a series of stats known collectively as adjusted passing stats. Similar to the reasonably common OPS+ and ERA+ from baseball, all stats are adjusted to a scale with 100 being average and higher numbers being better. For example, Peyton Manning’s earth-shattering 2004 season had a TD%+ of 168 because his touchdown percentage was 68 percent better than the average quarterback.
Rate stats can be just as valuable if not more valuable than season totals. A player may finish with a handful of extra pass attempts to post more touchdowns and yards, but other players may be more resourceful in those stats while having fewer attempts.
Despite 57 players starting games, only 53 will be included in this statistical outlook. The cutoff is 50 pass attempts, a mark that Robert Griffin, A.J. McCarron, Colt McCoy, Sean Mannion, and Trevor Siemian failed to hit, but Matt Barkley threw enough passes, making him the 53rd quarterback included.
There will be two rankings made: one with an adjustment for pass attempts and one without. The pass attempt adjustment levels the playing field as some players with 100 pass attempts were able to accumulate high rate tallies that would likely be unsustainable for 500 or 600 attempts.
For the pass attempt adjustment, two scales were made. A scale with 332 pass attempts (the average of the 53 quarterbacks’ pass attempts) and 400 pass attempts (based on 25 attempts per game in a 16-game season). A basic formula divides the number of pass attempts by 332 or 400 and multiplies the number by 100 to properly scale it. Jared Goff and Jameis Winston had a “pass attempts+” metrics of 189 (332 pass attempt scale) and 157 (400 pass attempt scale). After rounding to the nearest whole number, the numbers were added to the original nine indexes.
Sack%+ can be skewed with poor offensive lines, but the decision has been made to include its data within the experiment.
The 53 quarterbacks will be ranked in terms of total performance in the following indexes: yards per attempt, net yards per attempt, adjusted yards per attempt, adjusted net yards per attempt, completion percentage, touchdown percentage, interception percentage, sack percentage, and rating index. After adding the numbers together, totals will be divided by nine (the number of indexes) to create the final index. Again, 100 is average.
The main ranking is how the players fared without an adjustment for the number of pass attempts. The numbers within the parentheses are the adjusted rank with 332 pass attempts and 400 pass attempts.
You can look at my spreadsheet here.
Key:
Y/A+ = yards per attempt index
NY/A+ = net yards per attempt index
AY/A+ = adjusted yards per attempt index
ANY/A+ = adjusted net yards per attempt index
Comp%+ = completion percentage index
TD%+ = touchdown percentage index
INT%+ = interception percentage index
Sack%+ = sack percentage index
Rate+ = passer rating index
53 – Will Grier, Carolina Panthers, 37.2 Grade (53, 53)
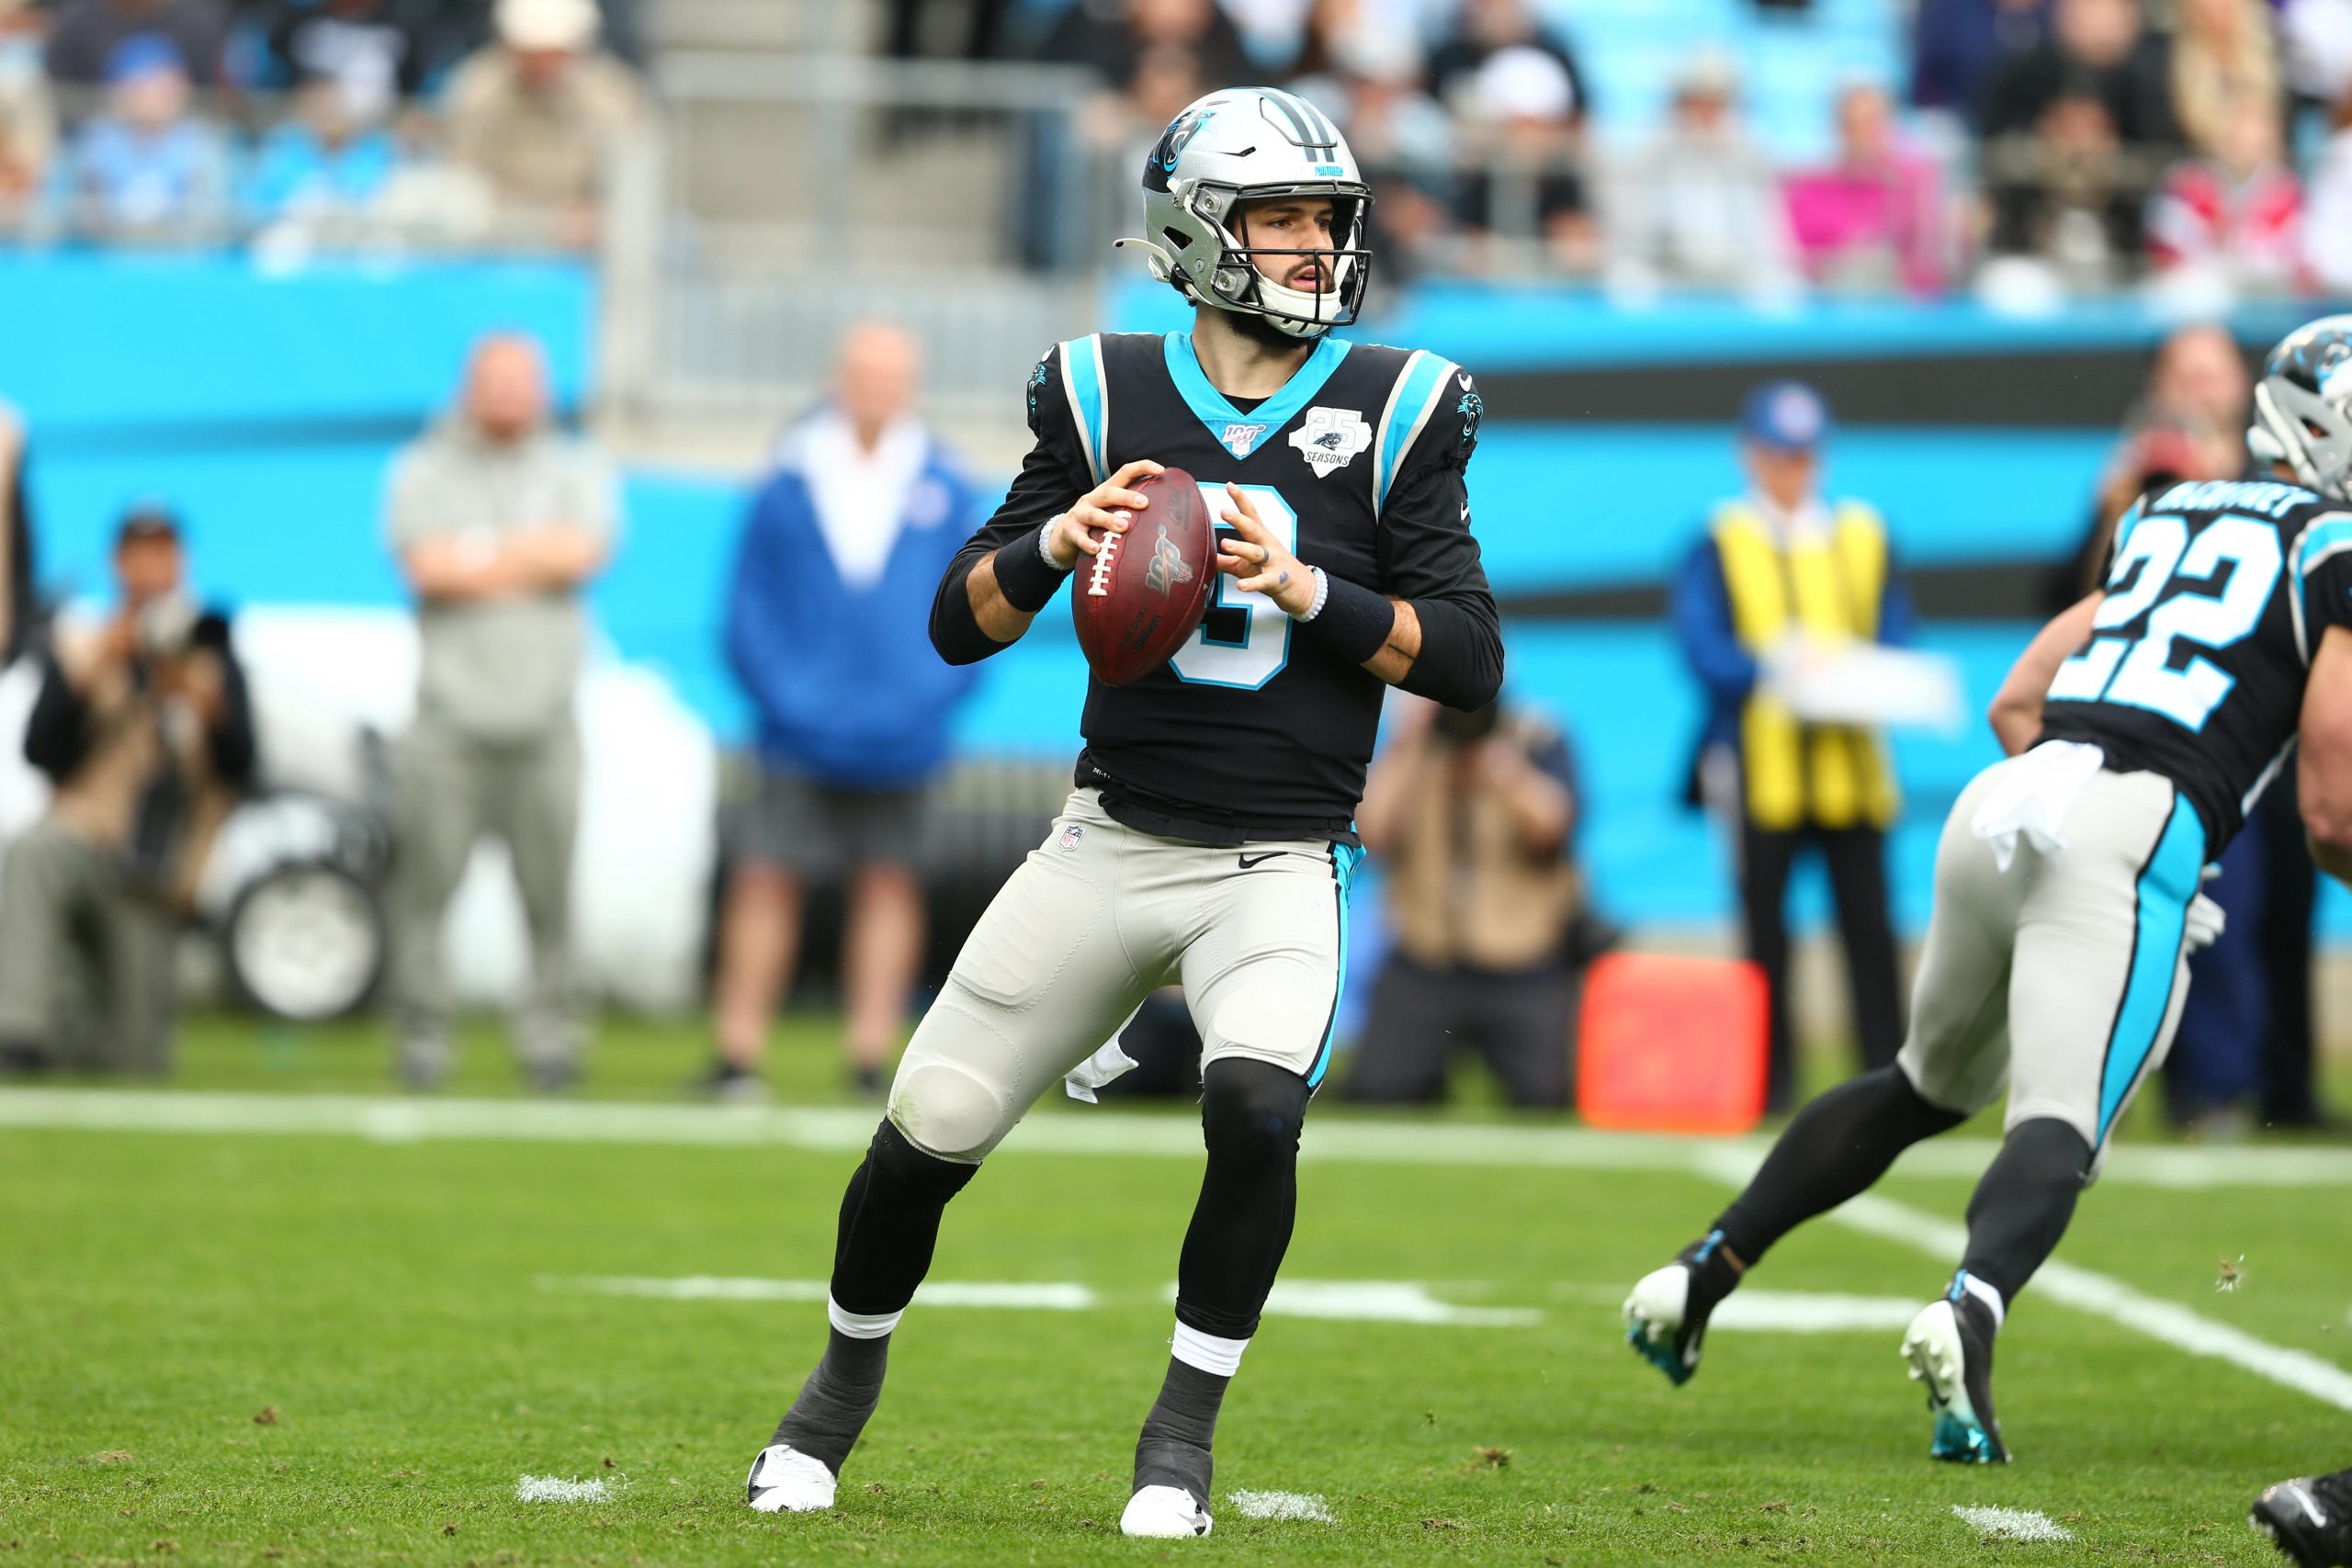
Grier was just terrible in his two starts with the Panthers. The highlights of Grier’s stats are his 14 in AY/A+ and INT%+. In simpler terms, Grier was 86 percent below average in those metrics. He was 33 percent worse than Josh Rosen in AY/A+ and 24 percent worse than Brian Hoyer in INT%+. Grier was not just bad; he was hilariously atrocious. Grier threw more pick-sixes than touchdowns, and he was pulled after eight attempts in his final start. Grier took six sacks and threw four interceptions in just 52 pass attempts and 87 total snaps on the field. He was given a PFF grade of 29.0. Out of the nine metrics, Grier finished last or tied for last in seven of them. He was 48th in Comp%+ and Sack%+. He is one of a handful of quarterbacks to not finish above average in any metric. Grier is currently the backup to Teddy Bridgewater in Carolina, but with XFL superstar P.J. Walker coming to the Panthers, Grier will need a killer performance to remain in the NFL.
52 – Josh Rosen, Miami Dolphins, 54.3 Grade (52, 52)
The former top-10 pick was somehow worse in 2020. After a 2018 mark of 71.7 (would have been 48th in 2019), Rosen fell in all nine stats. He finished 50th or worse in seven of nine marks. Rosen threw passes in five games, tossing one touchdown and five interceptions. In his two relief appearances, Rosen went 8-for-21 for 102 yards and a pair of interceptions, being sacked four times. In his first start of the season, Rosen avoided mistakes, but he completed just 46 percent of passes en route to barely hitting 200 yards on 39 pass attempts. The lone “bright spot” of Rosen’s season came against the Chargers where he found the end zone for the only time of the season. He completed 70 percent of his passes and finished with a solid 88.9 passer rating. For the sake of comparison, Philip Rivers posted an 88.5 passer rating for the season. Rosen was benched after a two-interception start the next week. He earned a 46.0 grade from PFF. Joining Grier, Rosen was not above average in any metric.
51 – Luke Falk, New York Jets, 57.3 Grade (51, 51)
Falk threw 73 passes across three games and two starts for the Jets, tossing zero touchdowns and a trio of interceptions. He played reasonably well in relief of Trevor Siemian, posting a 99.7 passer rating (same as 2019 Dak Prescott) and a 77.3 PFF grade. The 199th pick of the 2018 draft (yes, some people compared him to a certain Tom Brady) floundered in his two starts, getting sacked 14 times and completing 56 percent of passes and posting PFF grades of 47.3 and 25.9 respectively. Falk was tied for last in TD%+ and had a horrific Sack%+ of 17 (83 percent worse than average), but he did have the saving grace of a 101 in Comp%+. Falk was 50th or worse in four stats, but his Comp%+ was tied for 20th with Kyler Murray. Falk finished with a 42.2 PFF grade. The bright spot of a performance against the Browns might be worth a backup role in 2020, Falk’s viability as an NFL starter is one of the lowest of players that took snaps in 2019.


3 Responses