Matt Bishop | January 25th, 2019
We always talk about how deep the Outfield is, but if you were to construct your outfield from just this list of 25 players, you would be in great shape. With the exception of a few, there are at least 8 of the first 12 players on this list that have tremendous upside and could far exceed their draft value. And 11 of the 12 can be had outside the Top 100. There is tremendous value in the later rounds for the Outfield Position this year and you may not have to pay up for a stud:

Nicholas Castellanos 2014 – 2017:
.266/.314/.448 (.762 OPS) 6.3% BB 23.8% K 104 wRC+
.326 wOBA 39.3% FB 36.9% Hard Contact
Nicholas Castellanos 2018
.298/.354/.500 (.854 OPS) 7.2% BB 22.3% K 130 wRC+
.363 wOBA 35.8% FB 47.9% Hard Contact
Castellanos barreled 53 balls in 2018 (15th) with an 11.2% Barreled ball rate, which is up from 10.7% in 2017. While his K rate increased in 2018, his walk rate of 7.2% was the highest of his career and up 1% from his 6.2% mark in 2017. His inflated .361 BABIP is most likely to come down, but his hard contact rate of 47.9% is up 4.5% from his 43.4% in 2017. He is also crushing curveballs, hitting .353 against them and .380 against changeups. Here are two of his best months:
MAY (110 PA):
.356/.391/.577 (.968 OPS) 3 HR 12 RBI 14 R
3.6% BB 21.8% K .442 BABIP .409 wOBA 162 wRC+ 51.2% Hard Contact
53.8% Pull 31.3% Center 15.0% Oppo
SEPTEMBER (115 PA):
.350/.409/.590 (.999 OPS) 4 HR 16 RBI 15 R
10.4% BB 19.1% K .403 BABIP .413 wOBA 164 wRC+ 44.4% Hard Contact
38.3% Pull 35.8% Center 25.9% Oppo
If you look closely, you will see his walk rate skyrocket, while relying less on pulling the ball and using the whole field more frequently. I think this may be the year we see a Castellanos breakout.
Michael Conforto at 100th overall is an absolute steal. He is more than a year removed from surgery in September 2017 to repair a torn posterior capsule in his left shoulder, which is a game changer and a pretty serious injury. While initial reports stamped him with a six month recovery time, his 2018 results suffered, slugging only .216/.344/.366 (.710 OPS) in the first half of 2018, clearly indicating he may have come back too soon. His barrel rate dropped drastically to 9.5% from 12.6% in 2017, while his hard hit percentage dropped a staggering 7% to 36.6% from 43.5% in 2017.
But Conforto seemed to regain his old stride after the All-Star break with a .273/.356/.539 (.895 OPS) slash line with 17 HR 43 R and 52 RBI. What’s more impressive was his final month of the season:
SEPTEMBER 2018 (126 PA):
.286/.365/.616 (.981 OPS) 9 HR 17 R 29 RBI
10.3% BB 19.0% K .409 wOBA 165 wRC+
.291 BABIP 30.7% Hard Contact
While the hard contact rate is very low and his numbers are skewed by his 26.5% HR/FB rate, the BABIP has room for positive regression and these numbers should be more in line for Conforto with a full season of health. He could be a monster in 2019 and should crack the Top 50.

Aaron Hicks saw career highs in plate appearances (581), home runs (27), Runs (90) and RBI (79), all while lowering his walk rate to a career-high 15.5%, which was the 5th best walk rate in the league. His 39.5% hard contact rate was up a whopping 9% from his 30.5% rate the previous season. while his o-swing, or chase rate was down to a career-low 20.9%, which was the 7th best mark in the league. His 8.8% barrel rate has increased by 4% since 2016 and his EV (88.9 mph) and launch angle (12.5) were also career highs.
His breakout appeared to be happening, as he caught fire in June and July:
JUNE AND JULY (187 PA):
.276/.382/.564 (.946 OPS) 12 HR 31 R 26 RBI
14.4% BB 21.9% K .398 wOBA 153 wRC+
40.2% Flyball 44.9% Hard Contact
But he couldn’t sustain and underwhelmed the rest of the way, slashing .238/.374/.432 (.807 OPS). The alarming thing is that Hicks only hit .248 on the year in 2018 with a 78.0% contact rate, which was 75th in the league. If he could hit around .275, he could be in for a massive year. I love Aaron Hicks at 125 ADP.
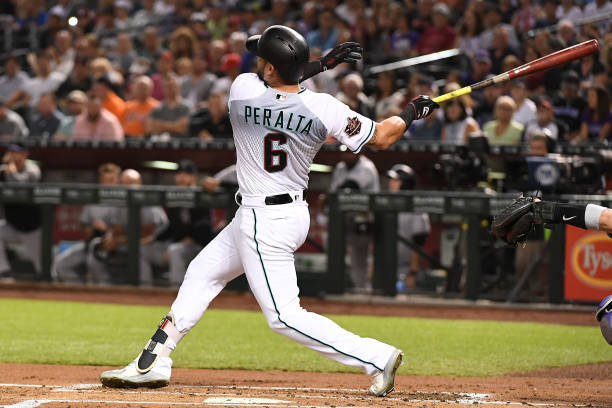
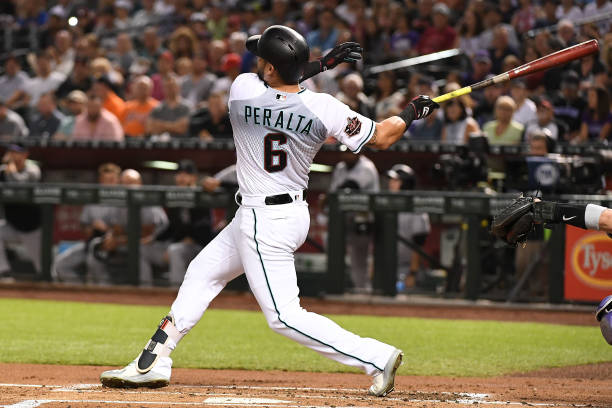
David Peralta flew under the radar in 2018 hitting 30 home runs and winning his first Silver Slugger Award. While his .293/.352/.516 (.868) slash line seems decent, his 17% increase in hard contact rate to 48.6% has got me salivating. What’s more impressive are two of his best months:
JUNE 2018 (115 PA):
.327/.391/.683 (1.074 OPS) 8 HR 15 R 22 RBI
8.7% BB 18.3% K .443 wOBA 180 wRC+
50.6% Pull 26.5% Center 22.9% Oppo
48.2% Hard Contact
AUGUST 2018 (105 PA):
.361/.410/.732 (1.141 OPS) 10 HR 18 R 21 RBI
7.6% BB 21.0% K .476 wOBA 202 wRC+
37.3% Pull 34.7% Center 28.0% Oppo
62.7% Hard Contact (WTF!)
I know this is only two months of the season and small sample size, but these are elite numbers and clearly worth your attention. Again, look at how the decrease in pull percentage led to a more balanced profile to all fields. What was surprising to me was Peralta’s 6.7° launch angle was well below the league average 10.9°. If he could elevate his swing even to the league average, we may have a superstar in Arizona. I’m excited for David Peralta in 2019 and at a 137 ADP, I’m buying him everywhere I can.

Harrison Bader showed flashes of offensive potential with a stellar August, in which he became an everyday player:
AUGUST 2018 (106 PA):
.301/.368/.538 (.906 OPS) 4 HR 17 R 13 RBI
6.6% BB 27.4% K .380 wOBA 141 wRC+
48.5% Hard Contact
While his seasonal slash line of .264/.334/.422 (.756 OPS) doesn’t jump off the page, he was able to drastically lower his swing rates, while increasing his contact rates across the board. Roster resource currently has Bader penciled in as the starting Center Fielder in St. Louis and going at 167 ADP, I think he has some upside that playing every day will bring out.
Brandon Nimmo burst on to the fantasy scene in 2018 and now we can’t look away. He started out with the Mets as a part-time player and didn’t get everyday at-bats until the beginning of May. He would make the most of his opportunities and rake into the summer:
APRIL, MAY, JUNE (247 PA)
264/.381/.538 (.919 OPS) 12 HR 38 R 25 RBI
11.3% BB 28.7% K .392 wOBA 154 wRC+
39.3% GB 42.2% FB 42.3% Hard Contact
He remained consistent throughout his entire 2018 campaign and a pleasant surprise to both the New York Mets and fantasy owners alike. He was dominant down the stretch and showed flashes of a hitter with an elite plate approach:
AUGUST AND SEPTEMBER 2018 (180 PA):
.288/.450/.504 (.954 OPS) 4 HR 25 R 16 RBI
20.0% BB 18.9% K .414 wOBA 168 wRC+
52.4% GB 23.8% FB 35.2% Hard Contact
While his decrease in Flyball rate and hard contact are concerning, he was clearly able to take a step forward in his development with a more disciplined plate approach. Brandon Nimmo is currently going at a 171 ADP and I am all in.
For more of our positional articles, you can find them here Starting Pitchers | First Base | Second Base | Short Stop | Third Base | Outfield Pt 1 |
Questions and comments?
thescorecrowsports@gmail.com
Follow Us on Twitter @thescorecrow
Follow Us on Reddit at u/TheScorecrow
Follow Mike Bishop on Twitter @bishphat
Main Credit Image:”[getty src=”1037490330″ width=”594″ height=”396″ tld=”com”]

